OpenActive’s mission — to make booking sport and exercise as easy as booking a hotel room or cinema ticket — requires ready access to high quality data. As the initiative scales up, listing around a million opportunities from acroyoga to wheelchair tennis, it is the perfect time to move our focus from just trying to get data out there, to ensuring that it includes everything needed to help someone get active. Following our work on a data quality reporting framework, we have developed a new tool to visualise and explore OpenActive data.
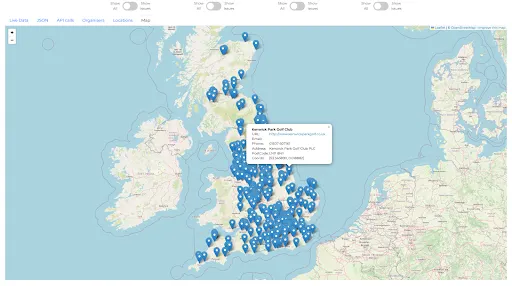
For those new to OpenActive, by default the visualiser shows a small sample of data from across all feeds, which can be viewed in a table, on a map or in the raw JSON source format. Users can then explore the deeper content of any particular feed in the OpenActive catalogue. Live data is read in real time, and can be filtered by organiser, location and activity type to hone in on areas of interest.
Working with the OpenActive community — a growing ecosystem of leisure providers, booking systems, brokers and activity finders — we defined a set of data quality measures that reflect the core use case, namely helping people to find and book activities. Firstly, these measures cover information needed to discover an opportunity, covering what (activity type, as per the official activity list), where (address, postal code or geospatial coordinates) and when (upcoming date and time). Secondly, information on how to make a booking for a given activity or event is also required, in the form of a link to an information or booking page. These measures were designed to ensure a good consumer experience, end-to-end, and provided the design basis for the tool presented here.
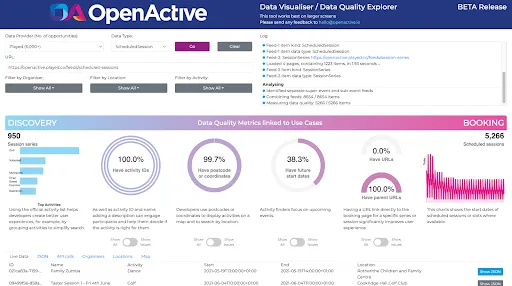
For OpenActive data publishers, the tool includes data quality indicators and filters which highlight records that have issues, based on the above measures. Raw data can be explored directly in the tool, helping to discover the source of problems and test solutions. There is also the option to read data at a link outside of the current official catalogue. This allows for quick tests of new feeds under development, without having to first get them in the live ecosystem.
This is a beta release and we welcome testing and feedback by the community. You can experience the tool in action at visualiser.openactive.io, so check it out and let us know what you think!
